
Do you want to contribute by writing guest posts on this blog?
Please contact us and send us a resume of previous articles that you have written.
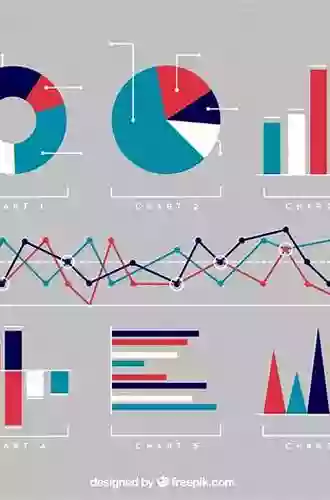
Create Interactive Visualizations For The Web With Chart.js

Visualizations are an invaluable tool for presenting complex data in a way that is easy to understand and interpret. Whether you are a data analyst, web developer, or simply someone trying to present data to others, having a powerful visualization library in your toolkit is crucial. In this article, we will explore Chart.js, a popular JavaScript library for creating interactive visualizations for the web.
Why Use Chart.js?
Chart.js is a versatile and user-friendly library that allows you to create beautiful, interactive charts with ease. It is built on the HTML5 canvas element, which provides a powerful rendering engine for creating dynamic and responsive visualizations. With Chart.js, you can easily create bar charts, line charts, pie charts, and many other types of visualizations.
One of the key advantages of Chart.js is its simplicity. The library provides a clean and intuitive API that makes it easy to get started, even for beginners. You don't need to have advanced coding skills or deep knowledge of data visualization techniques to create stunning charts with Chart.js. The library takes care of all the complex rendering and interaction logic, allowing you to focus on what matters the most - presenting your data effectively.
4.3 out of 5
| Language | : | English |
| File size | : | 13152 KB |
| Text-to-Speech | : | Enabled |
| Screen Reader | : | Supported |
| Enhanced typesetting | : | Enabled |
| Print length | : | 284 pages |
Getting Started with Chart.js
To begin using Chart.js, you first need to include the library in your HTML file. You can either download the library from the official website or include it via a CDN (Content Delivery Network) to have the latest version always available. Once the library is included, you can start creating your first chart.
Let's say you want to create a simple bar chart to visualize the sales performance of different products. First, you need to create a canvas element where the chart will be rendered:
<canvas id="myChart"></canvas>Next, you need to write JavaScript code to fetch the data and create the chart:
<script> var ctx = document.getElementById('myChart').getContext('2d'); var chart = new Chart(ctx,{type: 'bar', data: { labels: ['Product A', 'Product B', 'Product C'], datasets: [{ label: 'Sales', data: [500, 800, 1200], backgroundColor: '#3e95cd', borderColor: '#000000', borderWidth: 1 }] }, options: { responsive: true, scales: { y: { beginAtZero: true }}}}); </script>This code creates a bar chart using the canvas element with the ID "myChart". The chart data is defined within the "data" property, which includes the labels and dataset values. In this example, we have three products (Product A, B, and C) with their corresponding sales values. The chart options allow you to customize various aspects of the chart, such as responsiveness and scale settings.
Adding Interactivity and Animations
One of the great features of Chart.js is its ability to add interactivity and animations to your visualizations. This enhances the user experience and makes the charts more engaging and dynamic.
For example, you can add tooltips to your charts to provide additional information when the user hovers over a data point. To enable tooltips, you can add the following code to your chart options:
options: { plugins: { tooltip: { enabled: true }}}Similarly, you can enable animations to make your charts visually appealing. Animations can be applied to various chart elements, such as bars, lines, and pie slices. To enable animations, you can use the "animation" property inside your chart options:
options: { animation: { duration: 1000, easing: 'easeInOutQuad' }}Chart.js provides a wide range of customization options for adding interactivity and enhancing the visual appeal of your charts. You can explore the official documentation to learn more about these features and how to implement them in your own projects.
Create Stunning Visualizations with Chart.js
Chart.js is a powerful and flexible visualization library that allows you to create stunning visualizations for the web. Whether you are building a data-heavy dashboard or simply want to present information in an engaging way, Chart.js can help you achieve your goals with its intuitive API and comprehensive feature set.
Remember to choose descriptive and relevant long tail keywords for the 'alt' attribute of your visualization images to ensure accessibility and improve SEO. Consider using keywords like "interactive data visualization", "data charts for web", or "visualizing sales performance". These keywords will not only help search engines understand and index your visualizations, but also provide a better user experience for visually impaired visitors who rely on screen readers.
In this article, we explored Chart.js, a versatile JavaScript library for creating interactive visualizations for the web. We discussed the advantages of using Chart.js, how to get started with it, and how to add interactivity and animations to your visualizations. By leveraging the power of Chart.js, you can create compelling and informative visualizations that effectively communicate your data to your audience. So go ahead and start exploring the possibilities of Chart.js for your next web project!
4.3 out of 5
| Language | : | English |
| File size | : | 13152 KB |
| Text-to-Speech | : | Enabled |
| Screen Reader | : | Supported |
| Enhanced typesetting | : | Enabled |
| Print length | : | 284 pages |
Design interactive graphics and visuals for your data-driven applications using the popular open-source Chart.js data visualization library.
Key Features
- Harness the power of JavaScript, HTML, and CSS to create interactive visualizations
- Display quantitative information efficiently in the form of attractive charts by using Chart.js
- A practical guide for creating data-driven applications using open-source JavaScript library
Book Description
Chart.js is a free, open-source data visualization library, maintained by an active community of developers in GitHub, where it rates as the second most popular data visualization library. If you want to quickly create responsive Web-based data visualizations for the Web, Chart.js is a great choice.
This book guides the reader through dozens of practical examples, complete with code you can run and modify as you wish. It is a practical hands-on to Chart.js. If you have basic knowledge of HTML, CSS and JavaScript you can learn to create beautiful interactive Web Canvas-based visualizations for your data using Chart.js. This book will help you set up Chart.js in a Web page and show how to create each one of the eight Chart.js chart types. You will also learn how to configure most properties that override Chart’s default styles and behaviors. Practical applications of Chart.js are exemplified using real data files obtained from public data portals. You will learn how to load, parse, filter and select the data you wish to display from those files. You will also learn how to create visualizations that reveal patterns in the data. This book is based on Chart.js version 2.7.3 and ES2015 JavaScript.
By the end of the book, you will be able to create beautiful, efficient and interactive data visualizations for the Web using Chart.js.
What you will learn
- Learn how to create interactive and responsive data visualizations using Chart.js
- Learn how to create Canvas-based graphics without Canvas programming
- Create composite charts and configure animated data updates and transitions
- Efficiently display quantitative information using bar and line charts, scatterplots, and pie charts
- Learn how to load, parse, and filter external files in JSON and CSV formats
- Understand the benefits of using a data visualization framework
Who this book is for
The ideal target audience of this book includes web developers and designers, data journalists, data scientists and artists who wish to create interactive data visualizations for the Web. Basic knowledge of HTML, CSS, and JavaScript is required. No Canvas knowledge is necessary.
Table of Contents
- Technology Fundamentals
- Chart.js - Quick start
- Creating Charts
- Scales and Grid Configuration
- Configuring Styles and Interactivity
- Advanced Chart.js

 Richard Simmons
The Secrets of Chaplaincy: Unveiling the Pastoral...
Chaplaincy is a field that encompasses deep...

 Manuel Butler
Animales Wordbooks: Libros de Palabras para los Amantes...
Si eres un amante de los animales como yo,...

 Rod Ward
Let's Learn Russian: Unlocking the Mysteries of the...
Are you ready to embark...
 Rod Ward
The Incredible Adventures of Tap It Tad: Collins Big Cat...
Welcome to the enchanting world of...

 Eugene Powell
Schoolla Escuela Wordbookslibros De Palabras - Unlocking...
Growing up, one of the most significant...

 José Martí
15 Exciting Fun Facts About Canada for Curious Kids
Canada, the second-largest...

 Ken Simmons
What Did He Say? Unraveling the Mystery Behind His Words
Have you ever found yourself struggling to...

 Carlos Fuentes
A Delicious Journey through Foodla Comida Wordbookslibros...
Welcome to the world of Foodla Comida...

 Matt Reed
The Many Colors of Harpreet Singh: Embracing...
In a world that often...

 Chandler Ward
Welcome To Spain Welcome To The World 1259
Welcome to Spain, a country that captivates...

 Garrett Powell
Amazing Recipes for Appetizers, Canapes, and Toast: The...
When it comes to entertaining guests or...

 Emilio Cox
Days And Times Wordbooks: The Ultimate Guide to Mastering...
In the realm of language learning,...
Light bulbAdvertise smarter! Our strategic ad space ensures maximum exposure. Reserve your spot today!


 Gerald ParkerIntra Asian Trade And The World Market: Exploring the Vibrant History and...

 Jaden CoxFollow ·11.5k
 Philip BellFollow ·12.3k
 Eli BlairFollow ·14.3k
 Leon FosterFollow ·8k
 Kendall WardFollow ·5.2k
 August HayesFollow ·19.9k
 Steven HayesFollow ·14.6k
 Ivan CoxFollow ·15k
